When we want to know a standard deviation of a big population, we usually take a sample from the whole and than calculate estimator value. However it is not always clear which estimator should we use. Sometimes people argue whenever biased or unbiased standard deviation estimator is better. Below we explore this field and present the result of the numerical simulation.
Description
While estimating expected value usually does not have any related controversy, for standard deviation we have two competing estimators: biased: \(\sigma_n\) and unbiased: \(\sigma_{n-1}\). They are defined as follows:
$$ \sigma_n = \sqrt{ \frac{1}{n} \sum_{i=1}^n (x_i – \bar{x})^2} $$
and:
$$ \sigma_{n-1} = \sqrt{ \frac{1}{n-1} \sum_{i=1}^n (x_i – \bar{x})^2} $$
Detailed description of estimator bias can be read in wikipedia article.
For our experiment we generated population of \(10^6\) numbers with normal distribution (\(\mu=0, \sigma=1\)). Than for the subsequent sample sizes starting from \(n=5\) we randomly choose \(n\) numbers from the population – twice (they are chosen using uniform distribution). The first set is used for calculating \(\sigma_n\), the second for \(\sigma_{n-1}\). For each sample size the procedure is repeated \(r=500\) times and the final result for given sample and given estimator is calculated as the average over all \(r\) achieved values.
Results
The picture below, contains two charts presenting result of simulation.
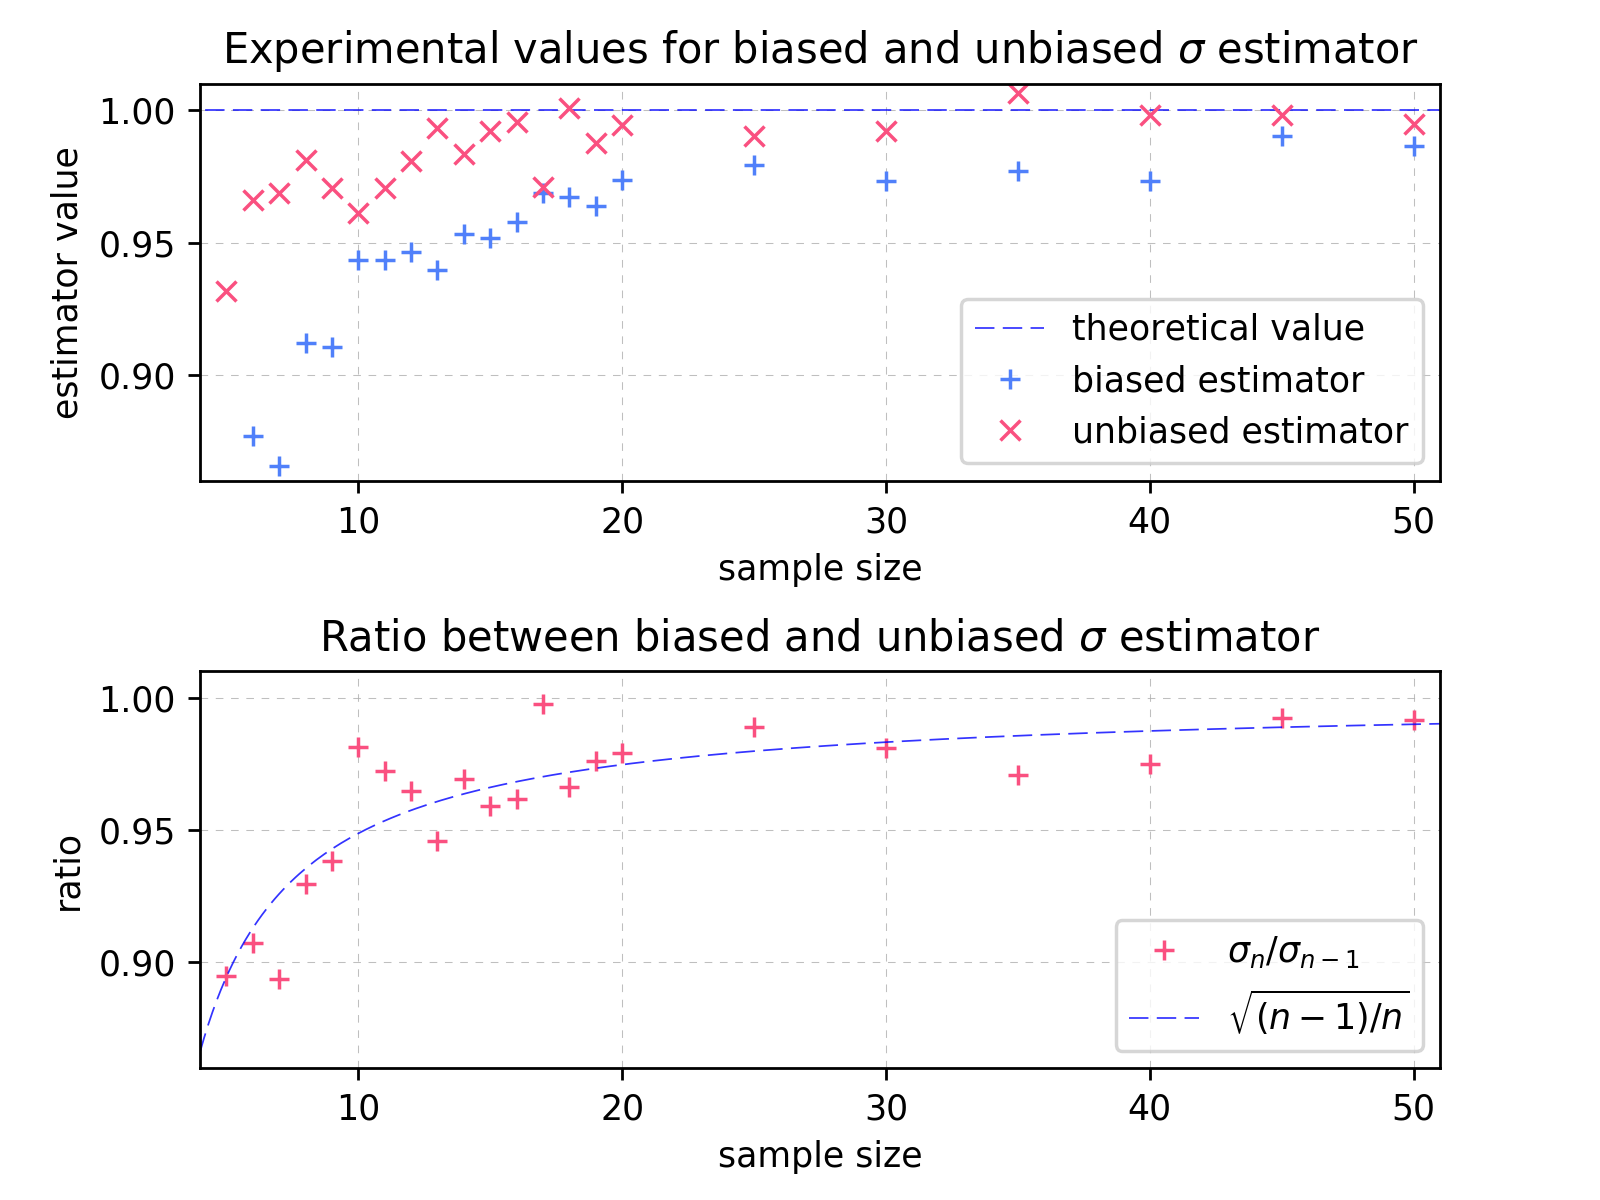
On the upper chart, each point represents achieved average result for given estimator – biased marked as “+”, unbiased as “x”. Biased and unbiased estimators were calculated on different samples. The blue dashed line represents theoretical value for given distribution. The lower chart shows ratio between biased and unbiased value together with asymptotic theoretical value (dashed line). For all presented sample sizes in given range the unbiased estimator gives better estimate of real standard deviation value.
In contrast to the presented behavior, the result for the higher values of sample sizes appears to be different – see the charts attached below:

As we can observe on the charts for the higher values of sample sizes, the achieved value seems to be uncorrelated with the estimator type.
Although the results presented here were based on normal population distribution, we have also tested uniform and Poisson distribution. They give similar results.
Summary
For small sample sizes estimator \(\sigma_{n-1}\) gives definitely better results, closer to the population theoretical value. As the \(n\) grows, the crucial factors are becoming similar:
$$ \sqrt{\frac{1}{n}} \approx \sqrt{\frac{1}{n-1}} \quad (\text{for n being sufficiently big}),$$
thus the difference between estimators becomes irrelevant.
The presented results were computed using numpy. For pseudo-random number generation we used Mersenne-Twister algorithm included in the library. Details of the implementation can be found at stdev_simul.py
Mikołaj Sitarz, 2019
![]()